Tuesday 13 November 2018
Comparing The Quality Of Debug Information Produced By Clang And Gcc
I've had an intuition that clang produces generally worse debuginfo than gcc for optimized C++ code. It seems that clang builds have more variables "optimized out" — i.e. when stopped inside a function where a variable is in scope, the compiler's generated debuginfo does not describe the value of the variable. This makes debuggers less effective, so I've attempted some qualitative analysis of the issue.
I chose to measure, for each parameter and local variable, the range of instruction bytes within its function over which the debuginfo can produce a value for this variable, and also the range of instruction bytes over which the debuginfo says the variable is in scope (i.e. the number of instruction bytes in the enclosing lexical block or function). I add those up over all variables, and compute the ratio of variable-defined-bytes to variable-in-scope-bytes. The higher this "definition coverage" ratio, the better.
This metric has some weaknesses. DWARF debuginfo doesn't give us accurate scopes for local variables; the defined-bytes for a variable defined halfway through its lexical scope will be about half of its in-scope-bytes, even if the debuginfo is perfect, so the ideal ratio is less than 1 (and unfortunately we can't compute it). In debug builds, and sometimes in optimized builds, compilers may give a single definition for the variable value that applies to the entire scope; this improves our metric even though the results are arguably worse. Sometimes compilers produce debuginfo that is simply incorrect; our metric doesn't account for that. Not all variables and functions are equally interesting for debugging, but this metric weighs them all equally. The metric assumes that the points of interest for a debugger are equally distributed over instruction bytes. On the other hand, the metric is relatively simple. It focuses on what we care about. It depends only on the debuginfo, not on the generated code or actual program executions. It's robust to constant scaling of code size. We can calculate the metric for any function or variable, which makes it easy to drill down into the results and lets us rank all functions by the quality of their debuginfo. We can compare the quality of debuginfo between different builds of the same binary at function granularity. The metric is sensitive to optimization decisions such as inlining; that's OK.
I built a debuginfo-quality tool in Rust to calculate this metric for an arbitrary ELF binary containing DWARF debuginfo. I applied it to the main Firefox binary libxul.so built with clang 8 (8.0.0-svn346538-1~exp1+0~20181109191347.1890~1.gbp6afd8e) and gcc 8 (8.2.1 20181105 (Red Hat 8.2.1-5)) using the default Mozilla build settings plus ac_add_options --enable-debug; for both compilers that sets the most relevant options to -g -Os -fno-omit-frame-pointer. I ignored the Rust compilation units in libxul since they use LLVM in both builds.

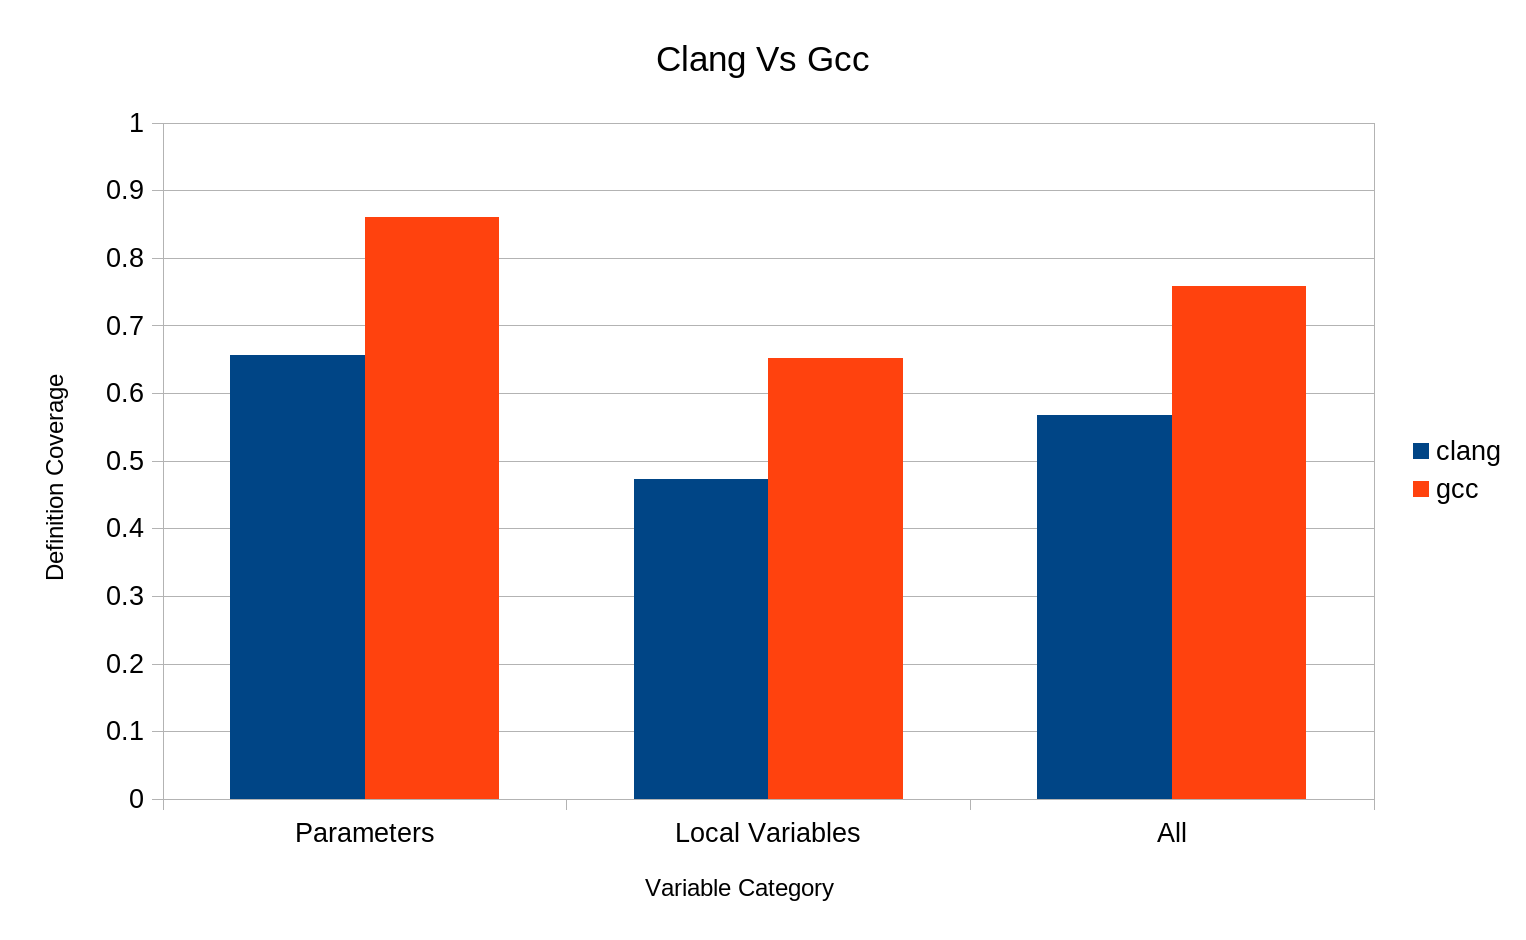
In our somewhat arbitrary metric, gcc is significantly ahead of clang for both parameters and local variables. "Parameters" includes the parameters of inlined functions. As mentioned above, the ideal ratio for local variables is actually less than 1, which explains at least part of the difference between parameters and local variables here.
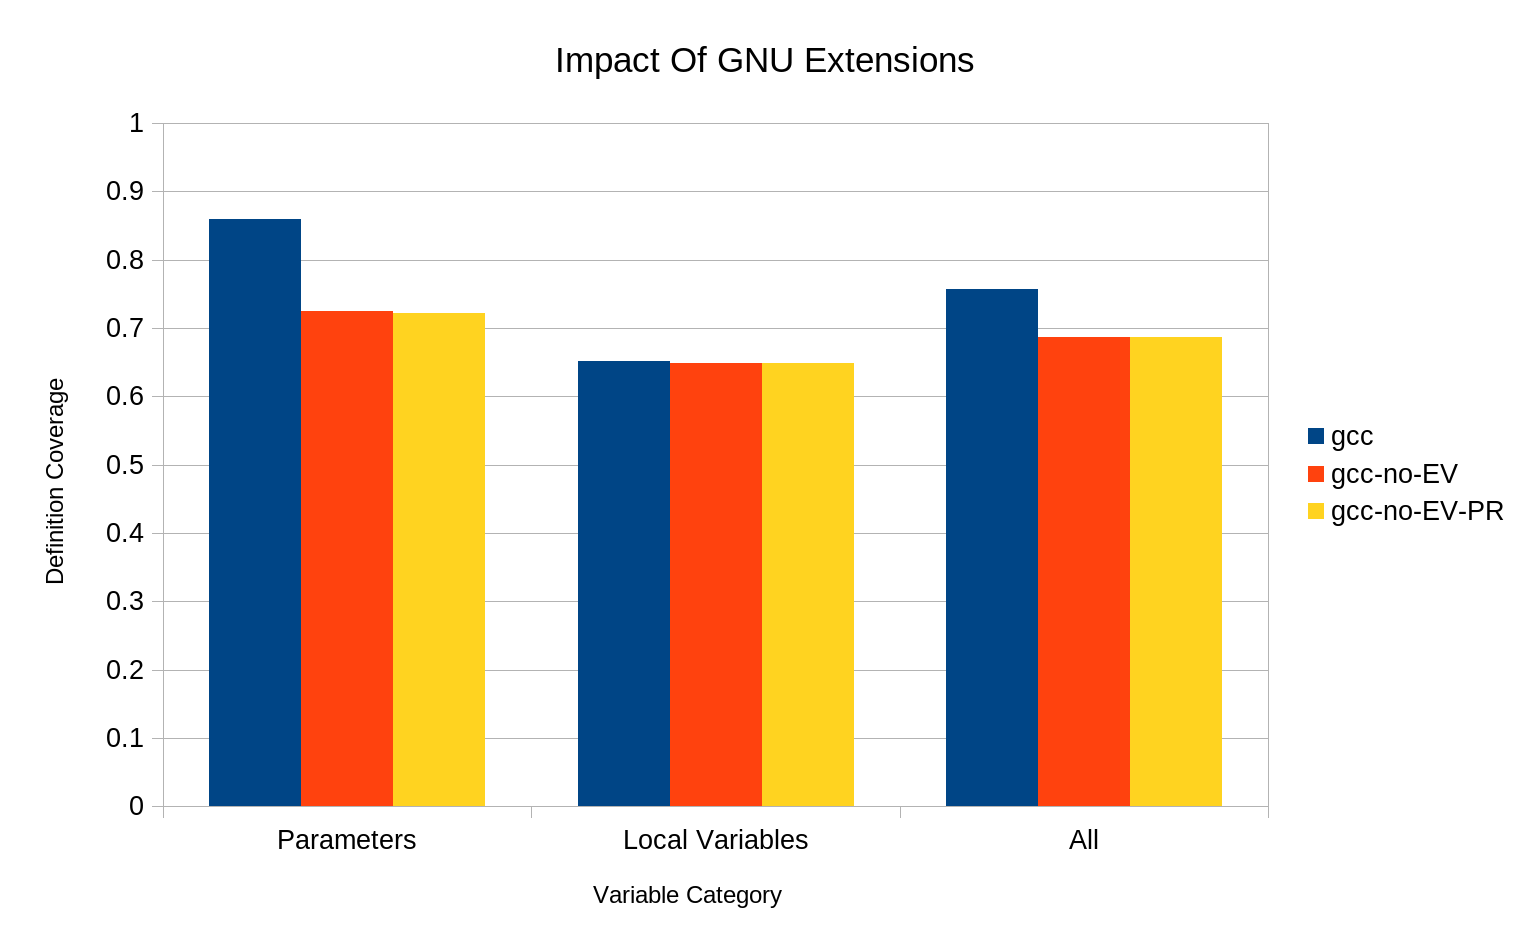
gcc uses some debuginfo features that clang doesn't know about yet. An important one is DW_OP_GNU_entry_value (standardized as DW_OP_entry_value in DWARF 5). This defines a variable (usually a parameter) in terms of an expression to be evaluated at the moment the function was entered. A traditional debugger can often evaluate such expressions after entering the function, by inspecting the caller's stack frame; our Pernosco debugger has easy access to all program states, so such expressions are no problem at all. I evaluated the impact of DW_OP_GNU_entry_value and the related DW_OP_GNU_parameter_ref by configuring debuginfo-quality to treat definitions using those features as missing. (I'm assuming that gcc only uses those features when a variable value is not otherwise available.)

DW_OP_GNU_entry_value has a big impact on parameters but almost no impact on local variables. It accounts for the majority, but not all, of gcc's advantage over clang for parameters. DW_OP_GNU_parameter_ref has almost no impact at all. However, in most cases where DW_OP_GNU_entry_value would be useful, users can work around its absence by manually inspecting earlier stack frames, especially when time-travel is available. Therefore implementing DW_OP_GNU_entry_value may not be as high a priority as these numbers would suggest.
Improving the local variable numbers may be more useful. I used debuginfo-quality to compare two binaries (clang-built and gcc-built), computing, for each function, the difference in the function's definition coverage ratios, looking only at local variables and sorting functions according to that difference:
debuginfo-quality --language cpp --functions --only-locals ~/tmp/clang-8-libxul.so ~/tmp/gcc-8-libxul.soThis gives us a list of functions starting with those where clang is generating the worst local variable information compared to gcc (and ending with the reverse). There are a lot of functions where clang failed to generate any variable definitions at all while gcc managed to generate definitions covering the whole function. I wonder if anyone is interested in looking at these functions and figuring out what needs to be fixed in clang.
Designing and implementing this kind of analysis is error-prone. I've made my analysis tool source code available, so feel free to point out any improvements that could be made.
Update Helpful people on Twitter pointed me to some excellent other work in this area. Dexter is another tool for measuring debuginfo quality; it's much more thorough than my tool, but less scalable and depends on a particular program execution. I think it complements my work nicely. It has led to ongoing work to improve LLVM debuginfo. There is also CheckDebugify infrastructure in LLVM to detect loss of debuginfo, which is also driving improvements. Alexandre Oliva has an excellent writeup of what gcc does to preserve debuginfo through optimization passes.
Update #2 Turns out llvm-dwarfdump has a --statistics option which measures something very similar to what I'm measuring. One difference is that if a variable has any definitions at all, llvm-dwarfdump treats the program point where it's first defined as the start of its scope. That's an assumption I didn't want to make. There is a graph of this metric over the last 5.5 years of clang, using clang 3.4 as a benchmark. It shows that things got really bad a couple of years ago but have since been improving.
Comments